
an AI pipeline that finds new and planned data centers and maps them worldwide
An automated pipeline that finds new and planned data centers in industry news and broker reports, geolocates them, and merges them with public databases into one deduplicated atlas of 10,578 sites worldwide, over 4,000 of them not yet operational. Built with an AI agent, vision-based PDF extraction, and geospatial deduplication.
the problem
Where is the world building its next data centers? There is no single list. Operational facilities are scattered across Wikidata, OpenStreetMap and PeeringDB. The sites that show where capacity is heading (planned campuses, projects under construction, land bought for future builds) mostly exist only as announcements in industry news and as tables inside broker market reports.
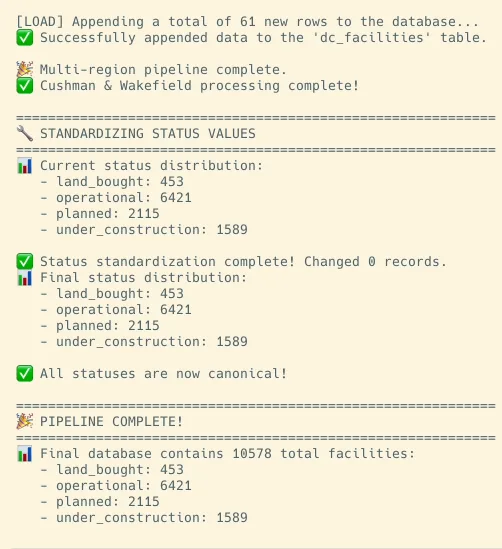
During an internship at AlphaGeo, a company that sells geographic datasets, I built a pipeline that finds those new and planned data centers automatically, puts coordinates on them so they can be mapped, and merges them with the known operational ones into a single deduplicated atlas. The latest full run held 10,578 facilities. Of those, 6,421 are operational and 4,157 are not built yet (2,115 planned, 1,589 under construction, and 453 sites where land has been bought). AlphaGeo still uses the pipeline, and the dataset of existing and upcoming data centers it produces is now one of the datasets they sell.
how it works
The pipeline is an ETL job that runs in three stages, each targeting a different kind of source. The first covers what already exists; the second and third find what is coming.
stage 1: public databases
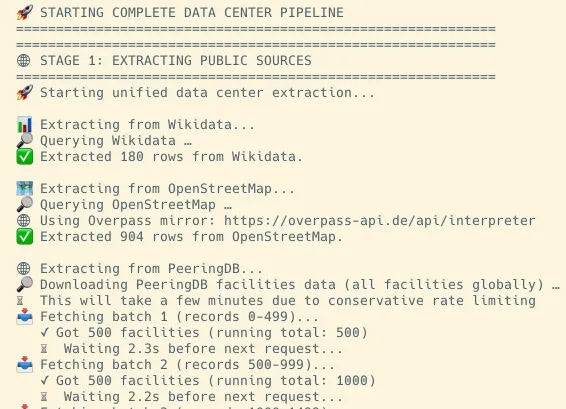
The first stage pulls structured records from Wikidata (via SPARQL), OpenStreetMap (via the Overpass API), and PeeringDB (via its REST API). Together these contribute roughly 6,400 unique operational facilities after deduplication. PeeringDB enforces strict rate limits, so requests are batched with randomized jitter between them to stay within its acceptable usage policy.
stage 2: news feeds
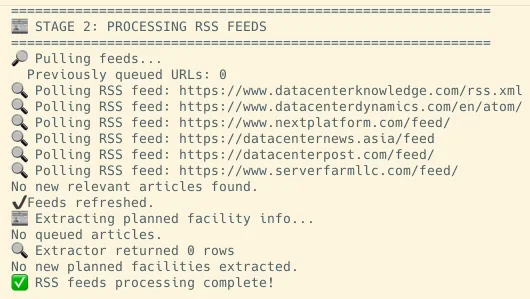
Next, six industry news feeds are polled for new articles. A keyword filter shortlists anything about data center construction, expansions, or land deals. Those articles are scraped asynchronously (15 concurrent workers with per-host connection limits) and sent to Gemini, which pulls out the operator, location, capacity in MW, investment, expected go-live date, and a status of planned, under construction, or land bought. Already-processed article URLs are skipped on the next run.
stage 3: the report-finding agent
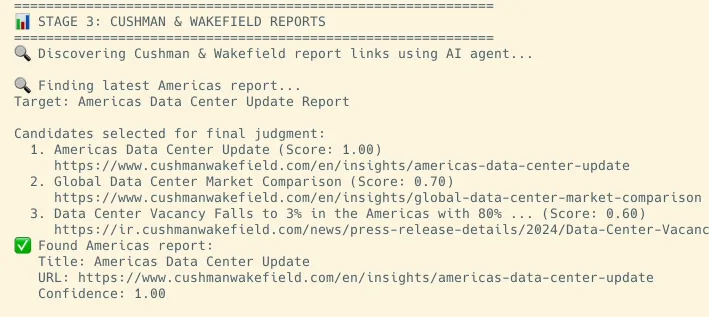
The richest source of planned capacity is Cushman & Wakefield’s regional data center market reports, which list projects in the pipeline for the Americas, EMEA and APAC. Each edition lives at a new URL, so instead of updating links by hand, I built a LangGraph state machine that finds the latest edition itself:
- Search Google via SerpAPI for candidate report pages
- Score each candidate with Gemini 2.5 Pro, using structured output (Pydantic models) that returns a confidence and the reasoning behind it
- If one candidate clearly wins (confidence of at least 0.85, and at least 0.2 ahead of the next), stop there and skip the expensive final check
- Otherwise, render the top candidates in headless Playwright browsers and give their full HTML to the LLM for a final decision
The screenshot below shows the agent evaluating candidates and selecting the Americas report with a confidence score of 1.00:
reading reports with no PDF
Once the agent finds a report, the next challenge is getting data out of it. Cushman & Wakefield publishes these reports as interactive FlippingBook web viewers with no downloadable PDF, so my scraper rebuilds one:
- Playwright navigates the viewer, detecting the platform variant (cushwake.cld.bz vs. digital.cushmanwakefield.com)
- Screenshots each page once its content has finished loading
- Reads the viewer’s page counter to know when it has reached the last page
- Stitches screenshots into a PDF, then converts each page to an image at 200 DPI
- Each image is sent to Gemini Vision for structured JSON extraction
As an optimization, only the first page is processed at first, to read which edition this is (the source specifier, e.g. “Americas H2 2024”). If that edition is already in the database, the remaining pages are skipped entirely. The reports are the biggest source of planned sites by far: about 4,000 of the atlas’s rows came from them.
putting sites on the map
Public databases already carry coordinates. Reports and news articles usually give an address, a city, or just a country, so the extraction prompts ask Gemini to return latitude and longitude from the most specific location available: a full street address for land sales, otherwise the centre of the city, county, state or country. That puts about 9,500 of the 10,578 facilities on the map, including roughly 3,700 of the not-yet-built ones from the reports.
geospatial deduplication
With data coming from three public databases, six news feeds and three report regions, the same facility often shows up more than once. The merge pipeline deduplicates at three levels:
- Source level: URL tracking for news, source specifier checking for reports, stable record IDs for public databases, so fetching a record again updates it instead of adding a copy
- Cross-source: two records are the same facility if they sit within 300 m of each other (measured in EPSG:3857 metres) and their names match at 90% or more on a token sort ratio. When two records merge, fields missing from one are filled in from the other
- Database level: composite primary keys
(source, source_specifier, id)withINSERT OR REPLACEfor atomic upserts
After all three stages complete, the pipeline maps every source’s status labels onto four standard values and reports the final counts:
architecture
Public sources, news feeds, and Cushman & Wakefield reports are processed in sequence, then deduplicated and stored in SQLite:
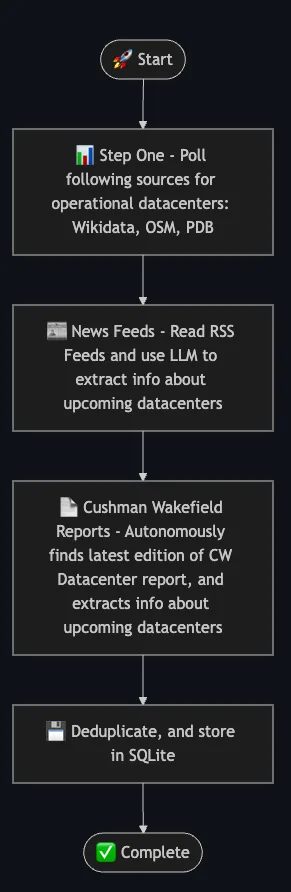
Under the hood, the codebase is split along the ETL stages: scrape/ (acquisition), extract/ (parsing + AI), transform/ (merge + dedup), load/ (persistence to SQLite via SQLAlchemy). All tunable parameters (concurrency limits, DPI, AI prompts, keyword filters, feed URLs) live in a single config.yaml.
limitations
- Coordinates for report and news rows are Gemini’s estimates from whatever location the source gives. A street address lands close; a city-only project lands on the city centre, so those points are only as precise as the city.
- In the run shown above, the 163 news-derived projects came through without coordinates, so they are in the database but not on the map.
- Deduplication is heuristic. A planned campus announced under a project codename and later listed under the operator’s name, or two buildings on one campus, can fool the 300 m and 90% name rule either way: one site kept as two records, or two sites merged into one.
- The report scraper is tied to how Cushman & Wakefield’s viewers behave today. A redesign of their viewer would need scraper changes.
what stuck with me
Check before you pay. Running a full Cushman report through Gemini Vision is the most expensive step in the pipeline. Extracting just page 1 first to see whether that edition is already stored meant a repeat run never pays to re-read an edition it already has.
Plan for the fallback path. The Playwright scraper tries direct PDF download first, falls back to FlippingBook navigation, then to generic keyboard-based page navigation. Each source has its own quirks, and building for those failure modes is what let the pipeline run unattended.
Make the model show its confidence. Using Pydantic models as Gemini’s output schema meant I got typed, validated JSON back instead of parsing free text. For the agent, asking for a confidence score and reasoning alongside each choice paid off twice: the code could skip the expensive deep analysis when one candidate clearly won, and when it picked wrong I could read why.